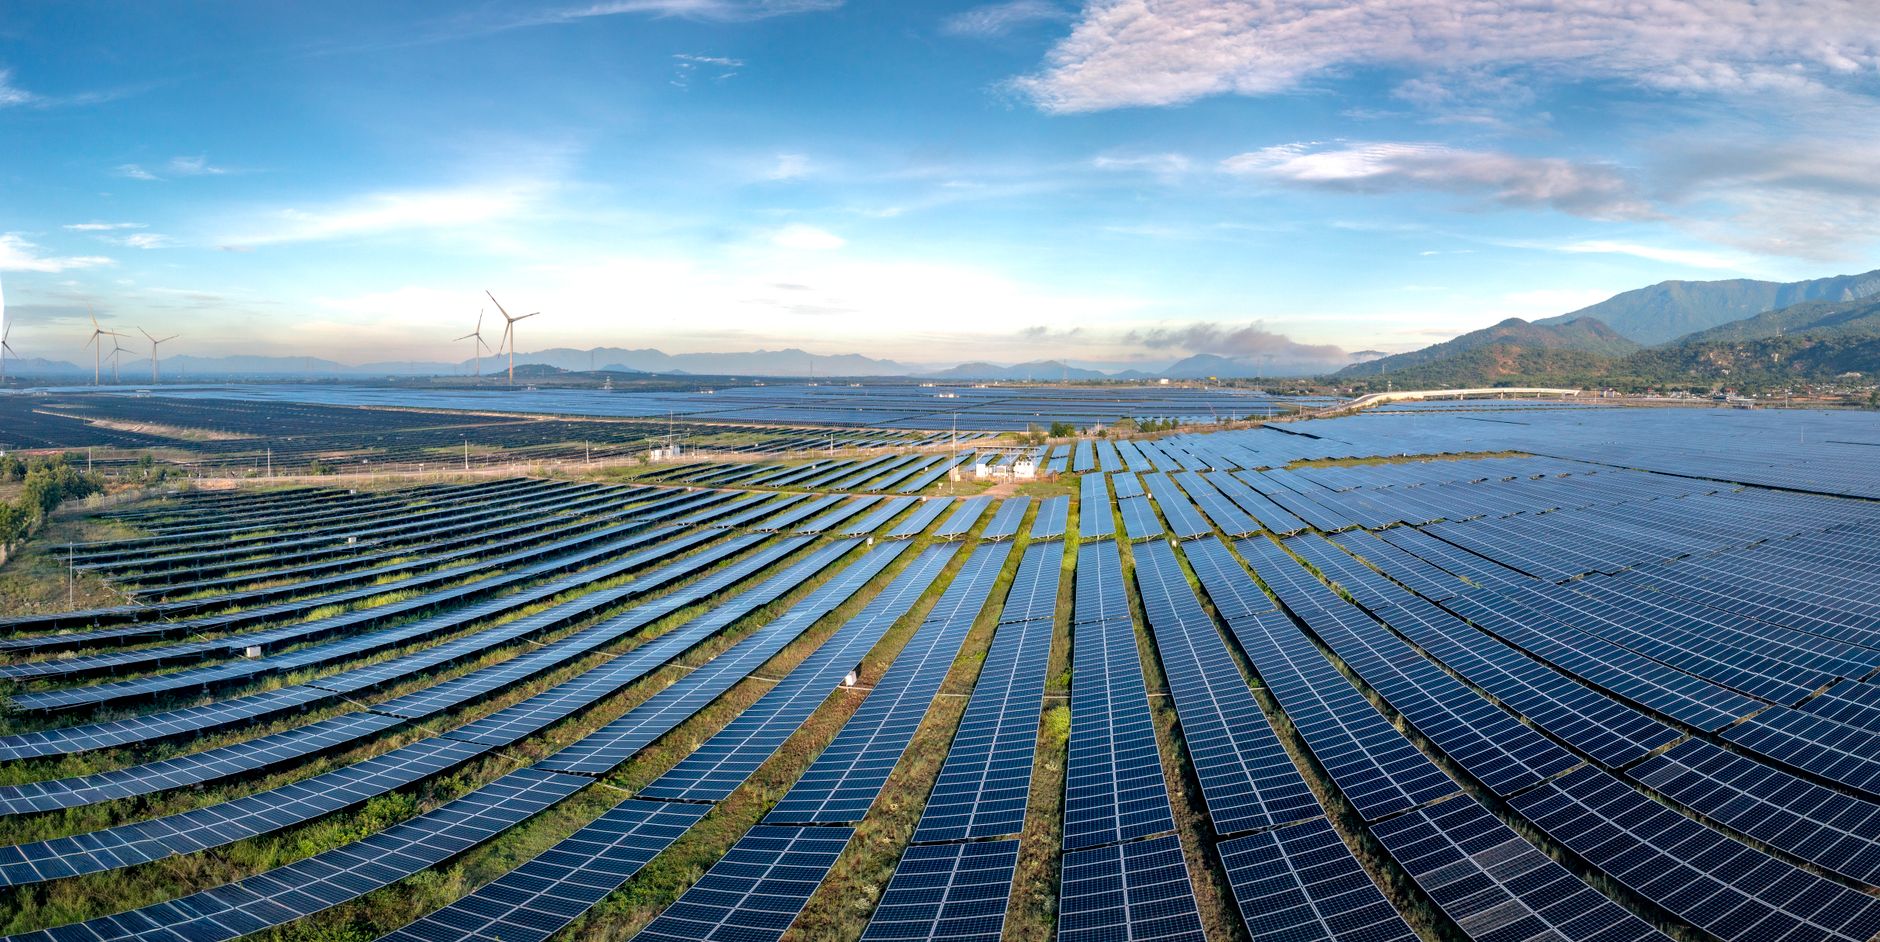
Why Two Plants With the Same Cost Can Be Completely Different Investments
A natural gas plant and an offshore wind farm can report the same levelized cost of electricity and still be entirely different investments. Yet the limitations of levelized cost of electricity show up precisely in that gap. One sells power whenever called upon. The other sells only when the wind blows. One faces volatile fuel costs and carbon risk. The other has almost no marginal cost but depends on a capital-heavy financing structure. LCOE reduces all of that to a single number per megawatt-hour, which is both its greatest strength and the source of its most serious misunderstandings.

Professionals across the electricity value chain use LCOE because it appears to offer a clean answer to a messy question: which source of generation is cheaper? That question matters for procurement, capacity planning, regulation, and investment. But the metric only answers part of it, and in some applications the missing part changes the decision entirely.
What Levelized Cost of Electricity Actually Measures
Levelized cost of electricity is a discounted cash flow metric. It divides the sum of all lifetime costs — capital expenditure, fixed and variable operation and maintenance, fuel, financing, and in some cases decommissioning or carbon costs — by the total electricity output expected over the same period, with both costs and output discounted to present value. The result is a cost per unit of energy, typically expressed in dollars or euros per megawatt-hour.
The calculation assumes a defined project life, a fixed discount rate, and a predictable output profile. It does not depend on when within that life the electricity is produced. A megawatt-hour in year one is treated the same as a megawatt-hour in year twenty, apart from the discounting of future cash flows.
The metric has its roots in regulated utility planning. Before liberalized wholesale markets became common, utilities compared generating options under a cost-of-service model. A single cost figure helped planners choose between plants that would serve a relatively stable demand and recover costs through regulated rates. That origin helps explain both the metric’s persistence and its blind spots when applied to today’s competitive, renewable-heavy systems.
Where the Metric Remains Useful
LCOE remains a reasonable screening tool when comparing projects with similar operating characteristics and risk profiles. Two combined-cycle gas turbines with different efficiencies can be compared usefully. Two utility-scale solar projects in the same region with similar capacity factors can be compared. The figure gives a quick sense of whether one design or supplier arrangement is likely to be cheaper over time.
It is also widely used in regulated procurement and auction design, where the system value of a project may be handled separately through connection requirements, capacity payments, or other mechanisms. In those settings, LCOE bid comparisons can work because the market rules define what the plant must deliver and what it will be paid.
The problem arises when LCOE is taken beyond that screening role and used as a substitute for system value, market revenue, or investment attractiveness. Those questions depend on more than the cost of producing a unit of energy. They depend on when and where the plant delivers power, the price it can realistically command, the risks it carries, and the flexibility it offers the wider system.
Time, Market Prices, and the Value of a Megawatt-Hour
Wholesale electricity prices vary by hour, season, and location. A megawatt-hour produced at 2 p.m. on a summer weekday can be worth many times a megawatt-hour produced at 3 a.m. on a mild spring night. LCOE has no mechanism to reflect this. It treats every generated megawatt-hour as if it were delivered into a constant price.
This matters most for variable renewable sources. Solar output is concentrated in the middle of the day. In markets with substantial solar capacity, midday prices tend to fall, sometimes close to zero or below. Wind output depends on weather patterns that may not align with high demand. The result is that a source can have a low LCOE and still earn relatively little in the market, because its output arrives when prices are depressed.
This effect is sometimes called price cannibalization: as more of a zero-marginal-cost resource enters a market, it suppresses the price during the hours when that resource produces, turning its own output into the cause of lower revenues. LCOE captures the cost side of this dynamic but completely misses the revenue side.
System operators and market analysts increasingly use metrics such as value-adjusted LCOE or system LCOE to account for the timing and location of generation. These approaches compare the cost of a technology with the value it provides to the system, including capacity adequacy, flexibility, and avoided network investment. They are conceptually closer to what matters in a power system, but they also require many more assumptions and are harder to communicate to non-specialist stakeholders.
Location and Grid Costs
LCOE is calculated at the plant gate. It excludes the cost of connecting the plant to the grid, reinforcing transmission corridors, or managing congestion that the plant’s output may cause. Two projects can report the same LCOE while imposing very different costs on the system. A remote wind farm with excellent wind resources may require hundreds of kilometres of new transmission. A solar project located close to existing substations and load centres may need relatively little additional infrastructure.
Grid connection costs are not a minor adjustment. In some markets, network charges and connection studies can change the effective delivered cost significantly, especially for projects in resource-rich but grid-poor regions. LCOE comparisons that ignore these locational factors can favour projects that appear cheapest on paper but are more expensive once they reach the point of consumption.
This is not simply an engineering inconvenience. It reflects the physical reality of alternating-current networks, where power flows follow impedance rather than contractual paths. A project that exports heavily during constrained hours can create local bottlenecks even when the wider system has spare capacity. Those bottlenecks have costs — redispatch, curtailment, or new infrastructure — that a plant-gate LCOE does not assign to the project responsible.
The Discount Rate and the Financing Blind Spot
LCOE results are highly sensitive to the discount rate used to calculate them. The discount rate represents the cost of capital or the required return on investment. It is not a technical parameter; it is a judgement about risk. For capital-intensive technologies such as wind, solar, or nuclear, most of the total cost is incurred before the plant produces its first megawatt-hour. A higher discount rate reduces the present value of future output and can raise the calculated LCOE substantially.
By contrast, a gas plant with lower upfront capital costs but significant fuel expenses is less sensitive to the discount rate, because more of its costs occur throughout the operating life. This means that the choice of discount rate can change the apparent relative cost of different technologies by more than many engineering assumptions.
Public LCOE comparisons rarely disclose the discount rate used. Different institutions use different rates, often reflecting different views about technology risk, market risk, and policy stability. A developer financing a project with equity expectations in the high single digits or low double digits may see a very different LCOE than a government planner using a lower social discount rate. These differences are not errors, but they mean that a published LCOE is never directly comparable across sources unless the assumptions are transparent.
Financing structure matters as well. Renewable projects in a supportive policy environment may secure long-term debt at low rates, reducing their LCOE. The same technology in a market with uncertain revenue or regulatory risk may face substantially higher financing costs. LCOE comparisons that take published estimates and apply them across markets without understanding financing conditions can be misleading.
When the Number Misleads
LCOE is least reliable when comparing dispatchable and non-dispatchable resources directly. A gas peaker with a high LCOE may still be valuable because it runs only when prices are very high. A combined-cycle plant with a lower LCOE may earn consistent revenue if it operates as baseload. A solar plant with an even lower LCOE may earn less because it produces mainly when prices are depressed. The cost per megawatt-hour does not indicate revenue, capacity value, flexibility, or system contribution.
It is also poorly suited to evaluating technologies whose value depends on services other than energy. Battery storage, demand response, and some flexible generation earn a substantial share of revenue from frequency response, reserves, or capacity payments. LCOE treats these as if the only product were energy, which can make storage appear far more expensive than it is in system terms.
Finally, LCOE can mislead when used to compare projects across jurisdictions with different market designs, fuel prices, carbon costs, or grid access. A coal plant’s LCOE in one country may not capture the same risks as a coal plant’s LCOE in another. Carbon pricing, air quality regulations, and fuel supply constraints can shift the real economics without appearing in a simple cost calculation.
Why a Single Number Persists
LCOE remains popular because electricity decisions are made by committees: utility boards, government agencies, investment committees, and regulators. These groups often need a simple metric to compare options, set procurement targets, or justify decisions to non-specialist audiences. A single cost per megawatt-hour is easier to communicate than a full system value analysis with locational marginal prices, capacity credit, flexibility value, and network cost allocation.
The number remains useful as a starting point, but only when the user understands what it excludes. Industry professionals rely on LCOE because it is standardized, transparent, and familiar. The difficulty arises when the figure is treated as a complete answer rather than a partial input.
In practice, LCOE is used alongside system value metrics, locational analysis, and a clear view of financing conditions for most planning and investment decisions. Treating it as one input among several avoids optimizing for the wrong objective. For analysts reviewing published LCOE comparisons, the revealing question is not which technology is cheapest but which assumptions are hidden inside the number. The answer usually explains more than the headline figure.
As power systems include more variable renewables, storage, and demand-side flexibility, the gap between cost per megawatt-hour and system value per megawatt-hour has widened. That does not reduce the need for cost benchmarks. It increases the need for professionals to understand precisely what LCOE captures and what it leaves out.
References
- IEA — Projected Costs of Generating Electricity: Methodology for levelized cost calculations and the influence of discount rates.
- BloombergNEF — Levelized Cost of Electricity analysis: Comparisons of generation costs and the limitations of plant-level metrics.
- IRENA — Renewable Power Generation Costs: Auction-based LCOE data and the role of financing conditions in cost outcomes.
- OECD/NEA — The Costs of Decarbonisation: System Costs with High Shares of Nuclear and Renewables: Discussion of system costs versus plant-level LCOE.