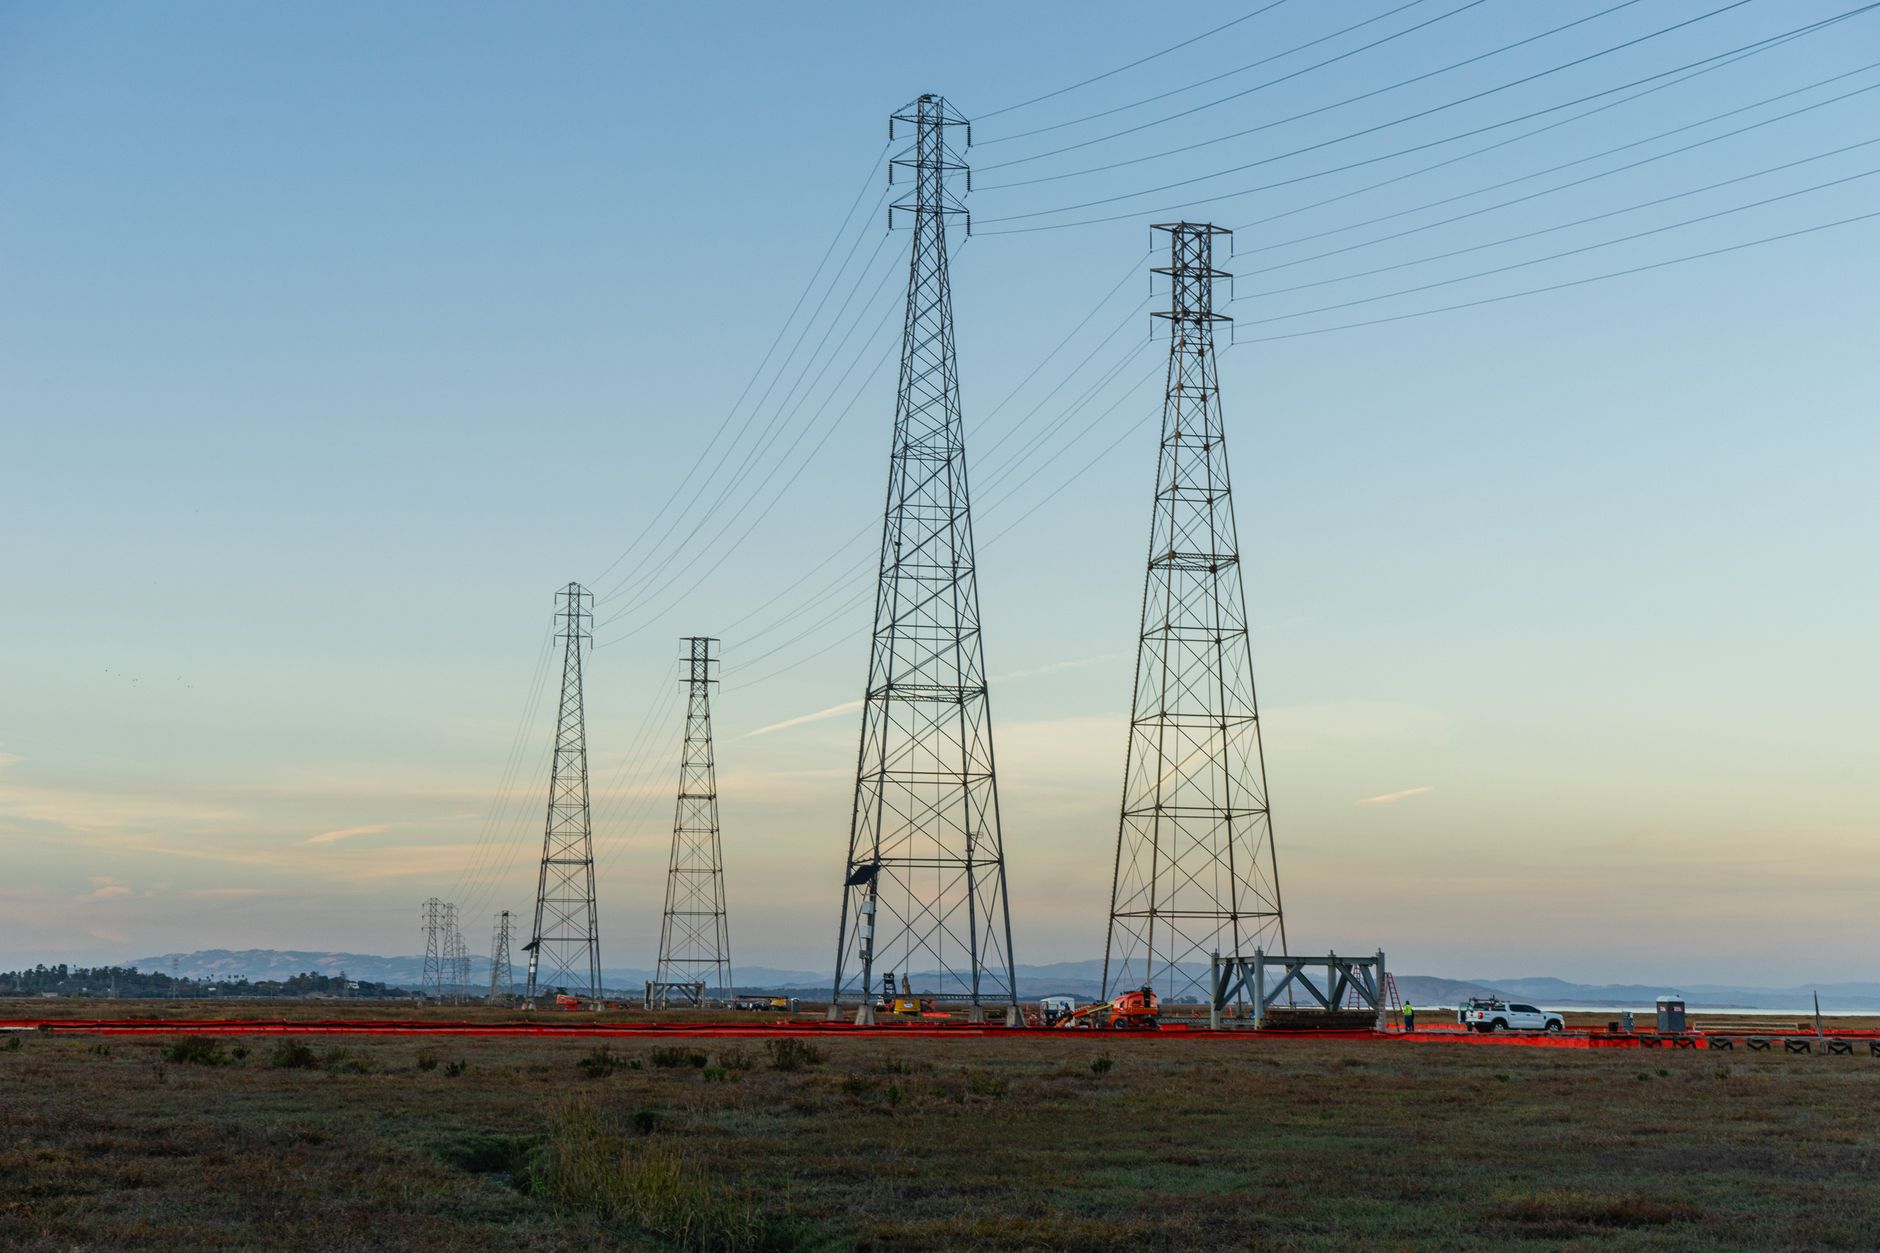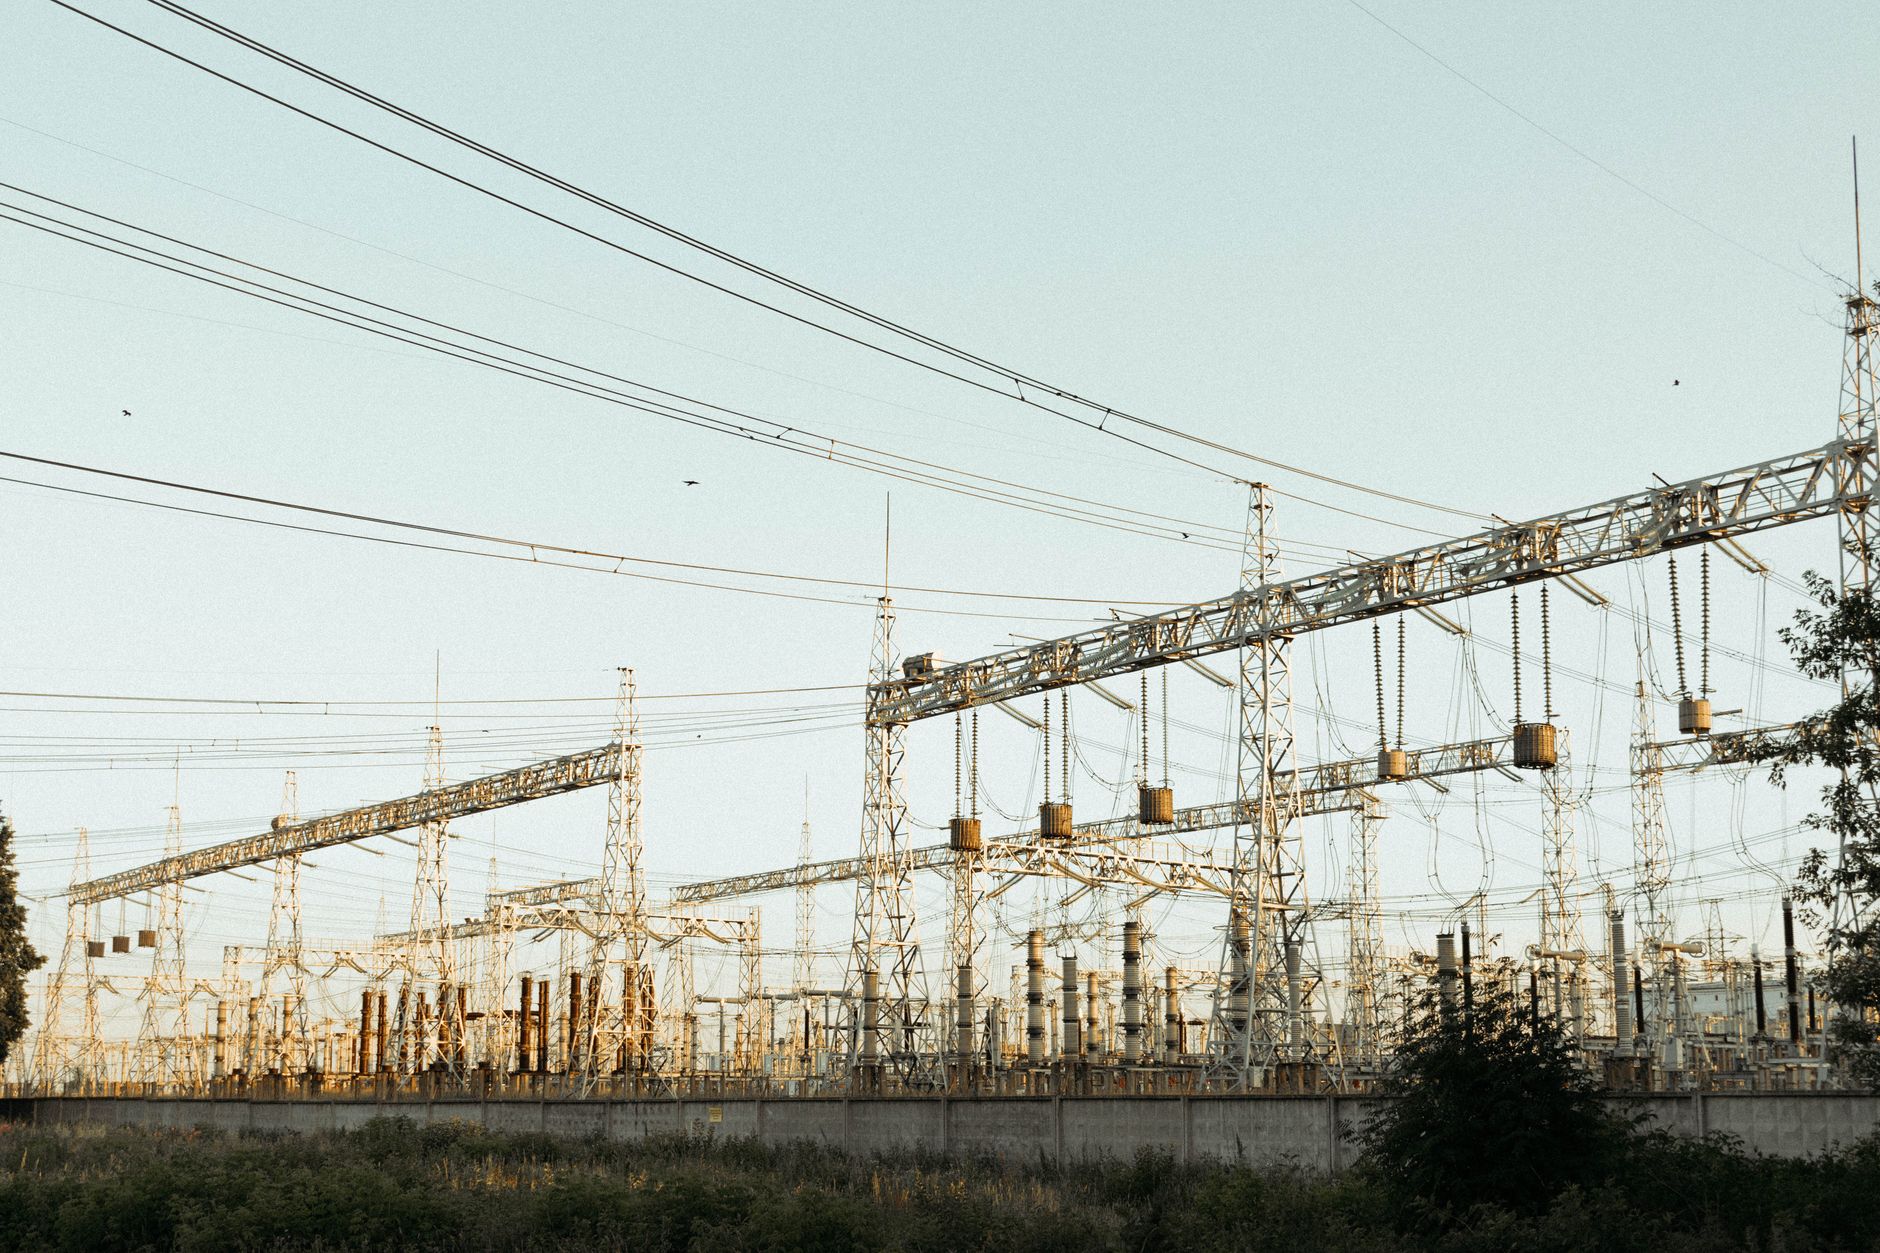
Distribution utilities spent most of the twentieth century with almost no visibility below the substation. A customer who lost power at 3 a.m. was the sensor, the phone call was the signal, and the first task for a repair crew on site was to find the fault. Billing operated on a monthly manual read: one number for total energy since the last visit, with no information about when consumption occurred or whether voltage had sagged. Smart meter data in grid operations changed much of that, though the first business case for it was billing, not operations.
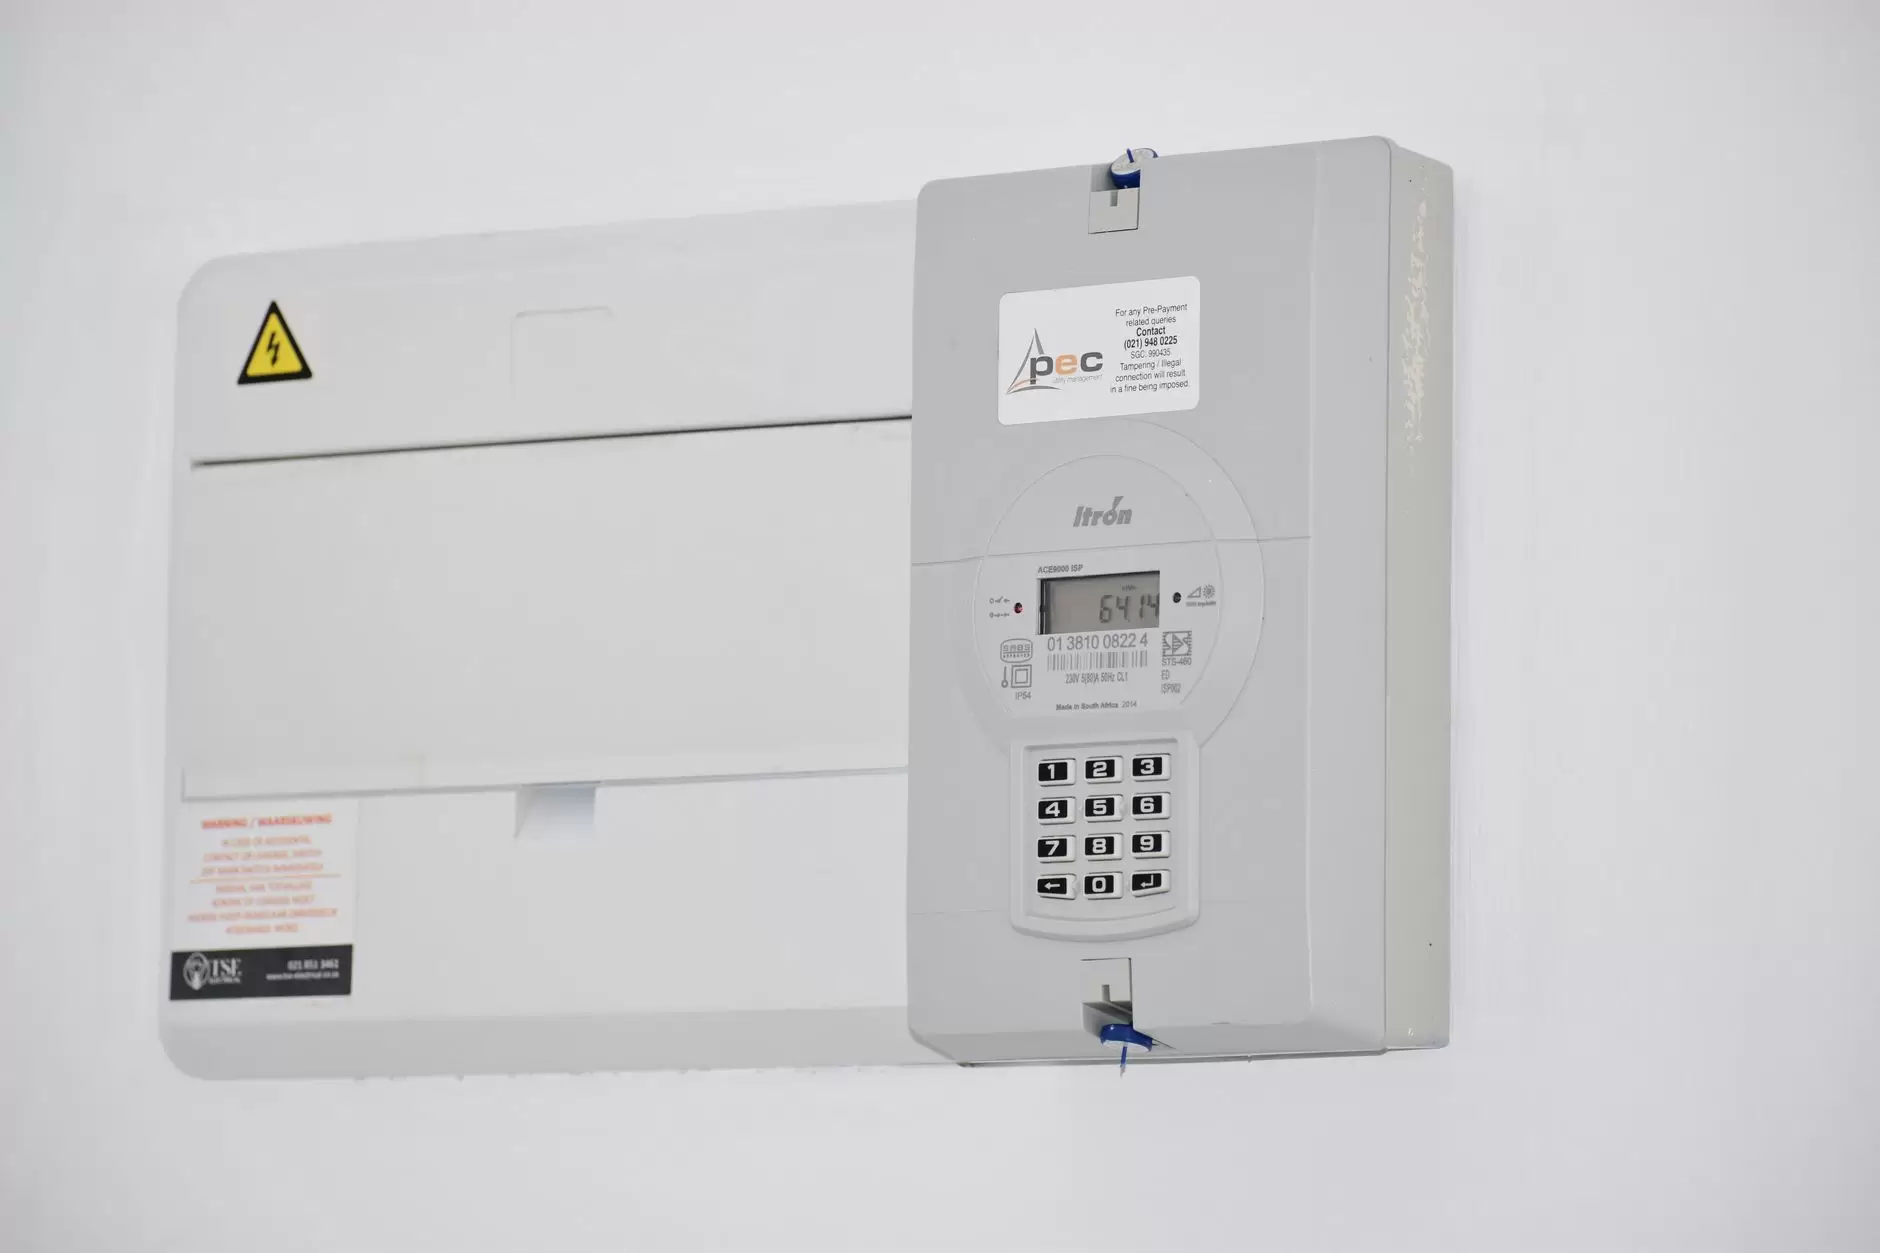
Smart meters changed part of that picture, but the most familiar application—remote billing—is a narrow slice of what interval data makes possible. Once energy use is time-stamped at millions of endpoints, the harder question is how that data supports outage management, load forecasting, distribution planning and the integration of distributed energy resources.
The Data a Smart Meter Produces
At its core, a smart meter is a digital meter with two-way communication. It records energy consumption in short intervals—commonly 15, 30 or 60 minutes, depending on local configuration—along with time stamps. Depending on the meter and the utility’s configuration, it may also record voltage, power factor and event flags for power loss, restoration or tampering. Two-way communication is what separates these devices from earlier automated meter reading systems, which typically transmitted a monthly total in one direction and offered little operational information.
Readings travel from the meter across a local network—often radio frequency mesh, power line carrier or cellular—to a head-end system, then into a meter data management platform that validates, stores and distributes the information. This is part of the same sensor, communication and automation layer that underpins wider digital grid infrastructure. The difference is volume: a large utility may manage hundreds of thousands or millions of endpoints, which changes what is practical to transmit and store.
Advanced metering networks are not normally designed for continuous streaming. Many utilities collect meter data in daily batches to reduce backhaul and communication cost. That architecture is adequate for billing, which tolerates delay, but it creates friction when the same data is expected to support operations that need near-real-time awareness. The interval length itself matters. Shorter intervals capture fast ramps and voltage excursions but increase data volume and communication load. Longer intervals reduce cost but obscure short-duration events such as motor starts or momentary interruptions. Regulators in some jurisdictions specify minimum interval requirements, which is why meter configurations differ across markets.
Outage Awareness and the Limits of the Last Gasp
The earliest operational use of smart meters was outage detection. A meter can send a final message, often called a last gasp, when it loses power, and a first message when service returns. When a control centre correlates these signals across many meters on the same distribution transformer or feeder, it can distinguish a single-premise problem from a transformer-level or feeder-level event. That capability changes repair dispatch. Instead of relying on customer calls and feeder-level alarms, operators can direct crews to a specific transformer or lateral, narrowing the search to a handful of premises. Grid modernization programs have extended this capability beyond large urban utilities, although implementation quality varies widely.
The operational weakness is that a missing meter read is not the same as a power outage. Communication failure, battery depletion or blocked radio paths can all produce silence. Operators therefore treat meter events as a probabilistic signal. A single silent meter may mean nothing; a cluster of silent meters on the same service area is a strong indicator of an outage, but a failed concentrator can mimic that pattern.
The same data can also indicate momentary interruptions—events shorter than a few minutes—that customers may not report but that can trip industrial equipment. Because a brief loss of supply rarely becomes a sustained outage, it often generates no trouble ticket. NERC reliability reporting distinguishes momentary interruptions from sustained outages, reflecting the operational burden of brief disturbances for industrial loads. Aggregating these events by feeder or service area helps utilities identify segments with repeated problems and prioritise reliability spending accordingly.
Load Forecasting and Distribution Planning
Traditional load forecasting for distribution planning often relies on feeder measurements and engineering assumptions. Below the substation, transformers and secondary networks have historically been unmeasured. A planning engineer might assume a conservative coincidence factor when sizing a transformer, because no data exists to show how much load is actually simultaneous. Interval meter data changes that. By aggregating reads from premises connected to the same transformer, a utility can estimate the transformer’s actual peak and how much headroom remains.
That becomes especially relevant when electric vehicle charging or heat pumps concentrate load on a small number of premises. Without interval data, a utility may not know that several homes on one transformer adopted overnight charging and now share a similar charging window. With aggregated data, the pattern is visible before the transformer overheats.
Most utilities use this information in aggregated form rather than monitoring individual households. Readings are grouped by transformer or feeder, which is the level at which distribution planning operates. Privacy rules and customer expectations limit how granular consumption data can be used, and aggregated load profiles are usually sufficient for planning purposes. Utilities are also pairing these aggregated profiles with digital twin simulations to evaluate where new load will create voltage or thermal constraints before reinforcement becomes urgent.
Distributed Energy Resources and the Net-Metering Blind Spot
Smart meters have a less obvious role in integrating distributed generation. A standard rooftop solar installation typically causes the meter to report net consumption: imported energy minus exported energy. The meter does not directly show gross generation or gross load without a separate production meter or inverter telemetry. This creates a blind spot for distribution operators, because a midday net export can hide a large load behind an even larger solar output.
Even with that limitation, meter data contributes to voltage management. Reverse power flow from distributed solar can raise voltage at the ends of feeders, and meters that record voltage at customer locations give operators evidence of where excursions are actually occurring. Some utilities combine these measurements with distribution automation to adjust tap settings or reactive power resources. The expanding connection of inverters under standards such as IEEE 1547-2018 has increased the need for that visibility, since inverter behaviour can raise or lower local voltage depending on settings.
Meter data also supports demand response and distributed energy aggregation. Where market rules allow aggregations of distributed energy resources to participate in wholesale markets, interval meter data is used to demonstrate that a portfolio responded as dispatched and to settle payments. The choice of baseline methodology—what a customer would have consumed without the event—remains a source of dispute, because small changes in baseline construction can shift payments materially.
Why Operational Use Still Lags Billing
Despite these capabilities, many utilities still use smart meters primarily for billing and basic outage notification. The constraints are partly technical, partly organisational. Data systems are fragmented: meter data management, outage management, geographic information and planning systems often evolved separately and do not exchange data easily. Data quality is uneven, with missing intervals, clock drift and firmware differences across meter fleets requiring cleaning before operational use.
- Latency matters. Daily batch collection is common and sufficient for billing, but it reduces value for near-real-time grid operations.
- Privacy and regulatory constraints limit how individual-level data can be used, pushing many applications toward less granular aggregation.
- Analytics investment is uneven. Utilities may have the data without the tools and operational workflows to use it for planning and control.
IEA analysis in Electricity 2025 makes a related point: digital monitoring is expanding, but operational integration and analytical capacity often lag the deployment of the hardware itself. Raw interval readings only become useful once they are integrated into operational workflows, validated and interpreted by staff with the training to act on them. The binding constraint tends to be the surrounding organisation rather than the meter itself.
What Changes as Meter Data Becomes Operational
A gradual shift is underway from batch collection toward event-driven messaging for selected high-value locations. Instead of waiting for the daily batch, some utilities configure certain meters to report immediately on voltage excursions, outage events or other triggers, while retaining periodic collection for the wider fleet. This selective approach balances communication cost with operational benefit.
Standards also shape how meter data connects to other systems. IEEE 1547-2018, for instance, defines interconnection requirements for distributed energy resources, including behaviours that affect local voltage; the same meter voltage data can help distribution operators verify that inverter settings are producing the expected grid impact. Meter data complements substation telemetry, feeder automation and dedicated power quality monitors rather than replacing them. Its value depends on how well surrounding systems convert raw reads into decisions. The continuing work is less about installing more meters than about making existing data available at the right time, in the right form, to the right operational process.
References
- IEA — Electricity 2025: smart meter deployment trends and the gap between digital monitoring and operational integration.
- IEEE 1547-2018: interconnection requirements for distributed energy resources and inverter voltage behaviour.
- NERC — Long-Term Reliability Assessment: reliability metrics and the distinction between sustained and momentary interruptions.