A manufacturer can record nearly identical monthly energy consumption in two different months and receive very different bills. The difference is rarely explained by the number of kilowatt-hours consumed. Industrial demand charges are what separate the two, and they are not built on consumption at all. They are built on the highest average power draw the meter records during a billing interval — the plant’s peak demand.

How a Billing Interval Creates the Demand Charge
Commercial and industrial electricity tariffs typically separate the bill into an energy charge, measured in kilowatt-hours, and a demand charge, measured in kilowatts. The energy charge tracks total consumption over the billing period. The demand charge tracks something different: the highest average power draw sustained over a metering interval. Common interval lengths are 15 or 30 minutes, although some tariffs use 5-minute or 60-minute intervals. The meter records the average power for each interval and applies a rate per kilowatt to the highest value.
This interval design explains why a motor inrush lasting a few seconds generally does not set the bill. Billing demand is the average power over the interval, not the instantaneous spike. Network equipment heats according to sustained current, so the interval approximates the thermal stress a facility places on conductors, transformers and switchgear. An inrush that lasts only a few cycles may be visible in a meter log but usually does not become the peak if the interval average remains lower.
Because the demand rate is expressed in kilowatts rather than kilowatt-hours, it can look like a modest line item on the tariff sheet and still dominate the bill for certain load shapes. A facility with a 1,500 kW peak and a demand rate of a few dollars per kilowatt can accrue demand charges that exceed its energy charge even when total consumption is relatively low. The relative balance between the two charges depends on the utility, the tariff class and the facility’s load factor.
Why One Peak Can Stay in the Bill for Months
The least visible feature of some tariffs is the demand ratchet. Once a facility records a high interval, that value may not disappear at the end of the billing cycle. Under many ratchet designs, the billed demand in each month is the higher of the current month’s peak or a percentage of the highest peak from the preceding 11 or 12 months. The percentage varies by tariff. A single interval in which two production lines start together during a summer afternoon can therefore influence the demand charge for an entire year.
The ratchet changes how plant operators think about risk. Even one operational mistake during a high-usage month can carry forward into the demand component for months afterward. That creates a different planning constraint than an energy-only bill, where a single high-consumption day simply adds to that month’s energy total. For facilities already operating with a low load factor, a ratchet can magnify the cost of an avoidable overlap between large loads.
Why Utilities Price Around Capacity, Not Just Energy
Demand charges are generally designed around the fact that network and generation capacity must be sized for the maximum load a customer may place on the system, not for the energy it happens to consume. A 1 MW load that appears for 15 minutes once a month still requires transformer, conductor and switchgear capacity comparable to a 1 MW load that runs continuously.
The energy charge alone would not recover the fixed cost of providing that capacity from a customer with very low total consumption. Cost allocation and tariff policy also shape how these charges are set, and the balance between demand and energy components varies between utilities and markets. The demand charge remains one mechanism for allocating the cost of infrastructure that must be in place regardless of how often it is used.
This is why demand charges tend to be particularly significant for facilities with low load factors. Load factor is the ratio of average load to peak load over the billing period. A low-load-factor facility uses its peak capacity for only a small share of the period, so the utility must recover network and generation capacity costs from fewer kilowatt-hours. Batch manufacturing, cold storage and water treatment plants often show this pattern: large motors or compressors run for concentrated periods, then sit idle, leaving a high demand charge relative to energy consumption.
Reducing Demand Exposure Without Halting Output
The first practical step is usually to identify which combination of equipment creates the billing peak. Many utilities provide interval data through customer portals, although granularity and access vary. Once the peak interval is understood, a facility can often reduce its demand charge by sequencing flexible loads so they do not overlap. In cold storage, pre-cooling before a shift can allow compressors to cycle down during the interval when other loads start. In manufacturing, starting large motors in sequence or delaying one batch process by a few minutes can reduce the recorded peak without reducing total output.
Behind-the-meter storage can reduce billed peak demand when the value of avoided charges justifies the investment. A battery system discharges during the facility’s peak interval and recharges when site demand is low. Whether this is economical depends on the demand charge rate, the shape of the load, battery cycle life and local interconnection rules. In utilities with time-of-use demand charges or separate peak-period rates, storage and demand response can be combined. But the economics are tariff-specific, and a battery that makes sense under one rate design may not make sense under another.
Some utilities measure demand in kilovolt-amperes rather than kilowatts. In that case, the demand component is based on apparent power, so a facility with poor power factor pays for more than the real power it draws. Power factor correction capacitors can reduce the recorded kVA where the tariff charges on that basis. Where the tariff meters only kilowatts, improving power factor does not reduce the kW demand charge, though it may affect a separate reactive power charge. Tariff language varies enough that the specific metering basis matters before investing in correction equipment.
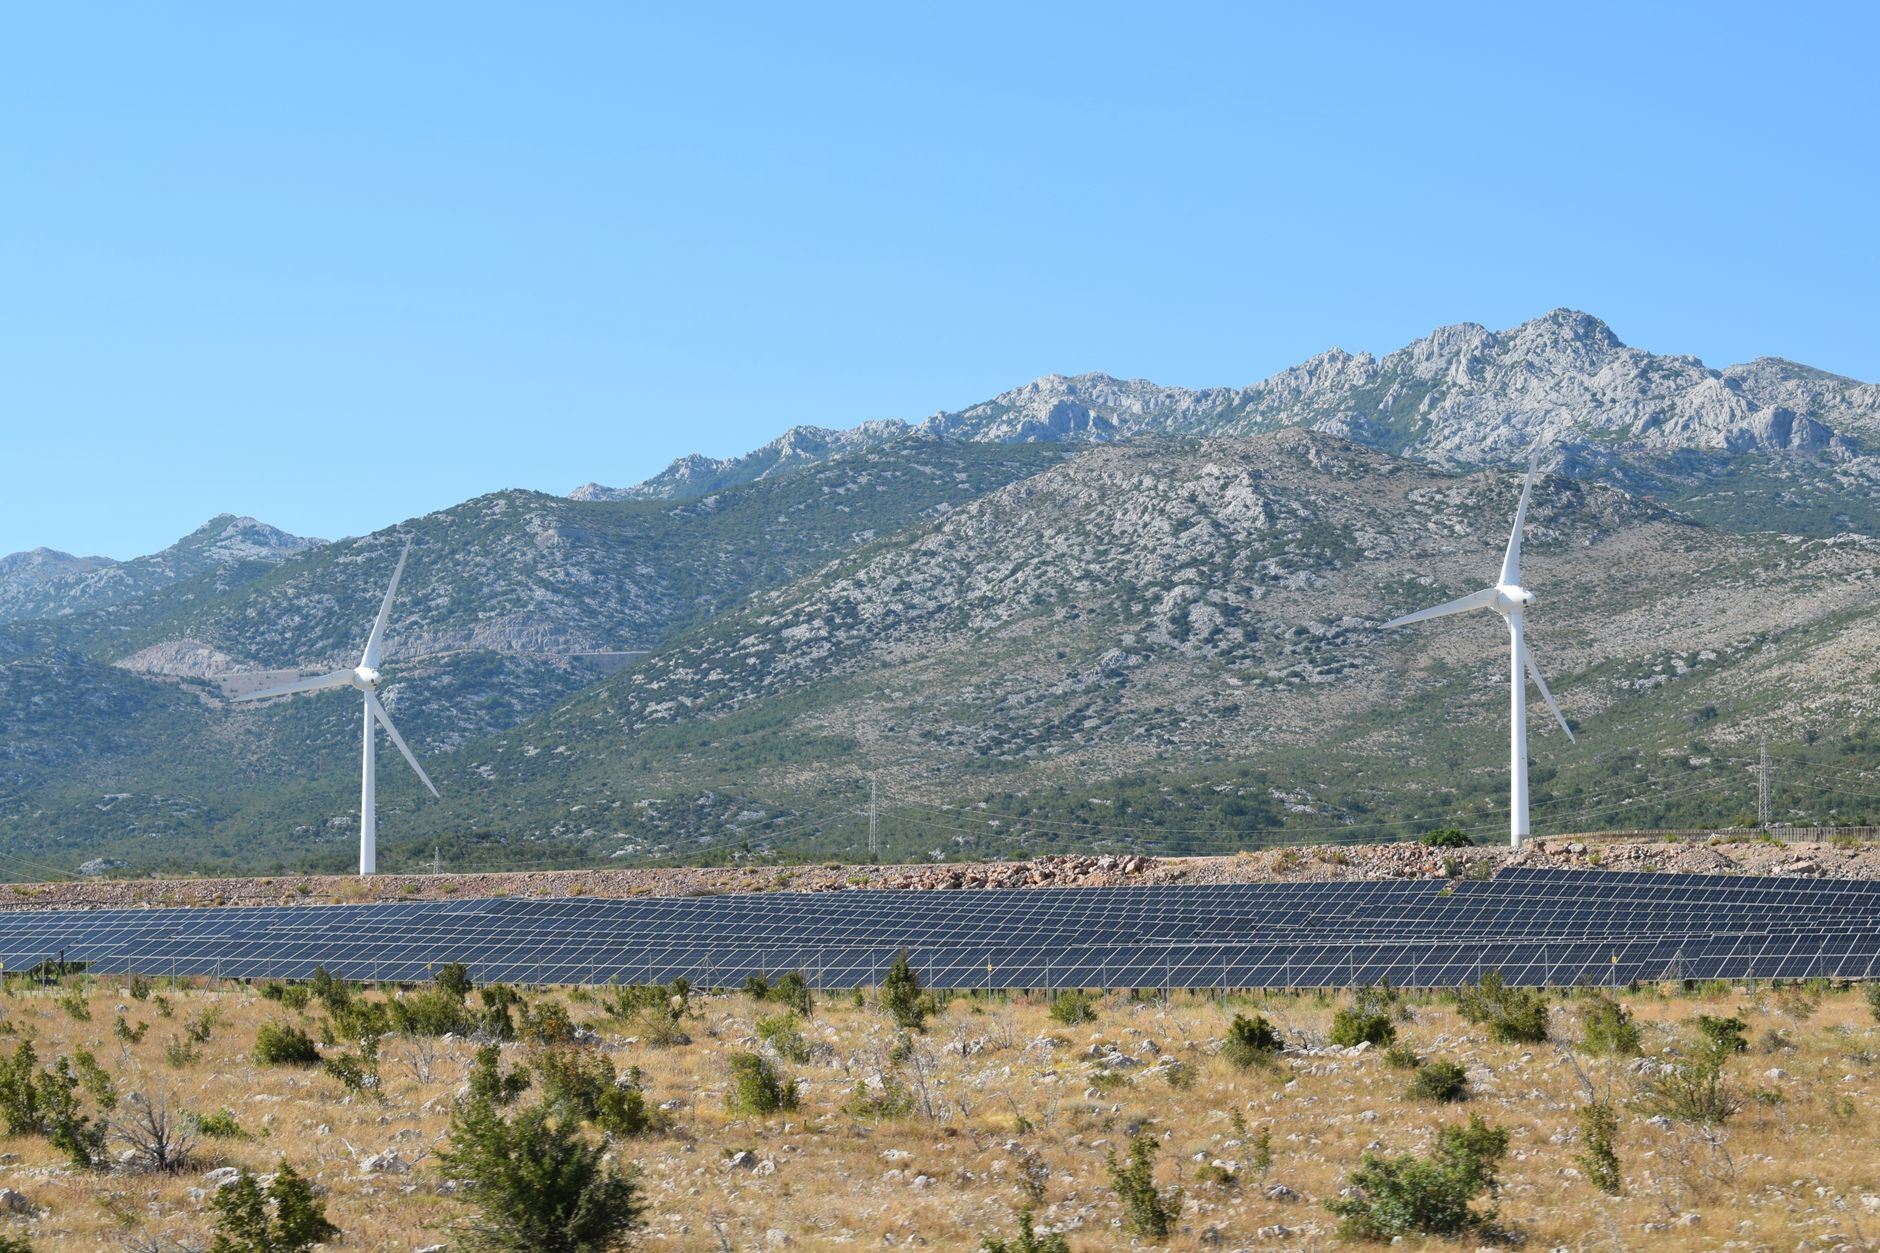
Sub-metering and behind-the-meter generation add another layer. In some jurisdictions, facilities with on-site solar or co-generation receive a different demand charge treatment, because the utility can net generation against the facility’s metered load during peak intervals. The specific rules vary by tariff and location. Where behind-the-meter generation aligns with the facility’s peak period, it can reduce the recorded demand even if it does not reduce total energy use by much. That distinction matters because the demand charge rewards reducing the highest interval, not the total monthly consumption.
Where Metering and Tariff Design Are Moving
Demand charge design is shifting in some markets. Instead of charging for the highest interval across the entire month, some utilities apply separate demand rates by time of day. Only the highest interval during system peak hours sets the peak-period demand charge, while a demand event at 3 a.m. falls into a different, often lower charge. This changes the operational calculation: a facility may have an overnight production spike without triggering the same cost as an afternoon spike. Some utilities are also introducing more granular interval meters and time-varying rates, which improves the visibility needed to manage demand charges, though adoption remains uneven across jurisdictions and tariff classes.
The demand charge is a rate design that creates an incentive for flatter load. The most cost-effective response depends on the shape of a facility’s demand and the specific tariff. Some plants can save through scheduling alone; others need storage, power factor correction, or a combination. Before investing in equipment, the practical first step is to review interval data and identify exactly which interval sets the monthly demand charge. That single interval is often the best place to start.
References
- IEEE 1100 — IEEE Recommended Practice for Powering and Grounding Electronic Equipment (Emerald Book) — definitions of demand, load factor and power factor used in this article.
- North American Electric Reliability Corporation — Long-Term Reliability Assessment — context on peak demand planning and industrial load characteristics.
- International Energy Agency — Electricity 2025 — context on industrial electricity consumption and peak demand trends.