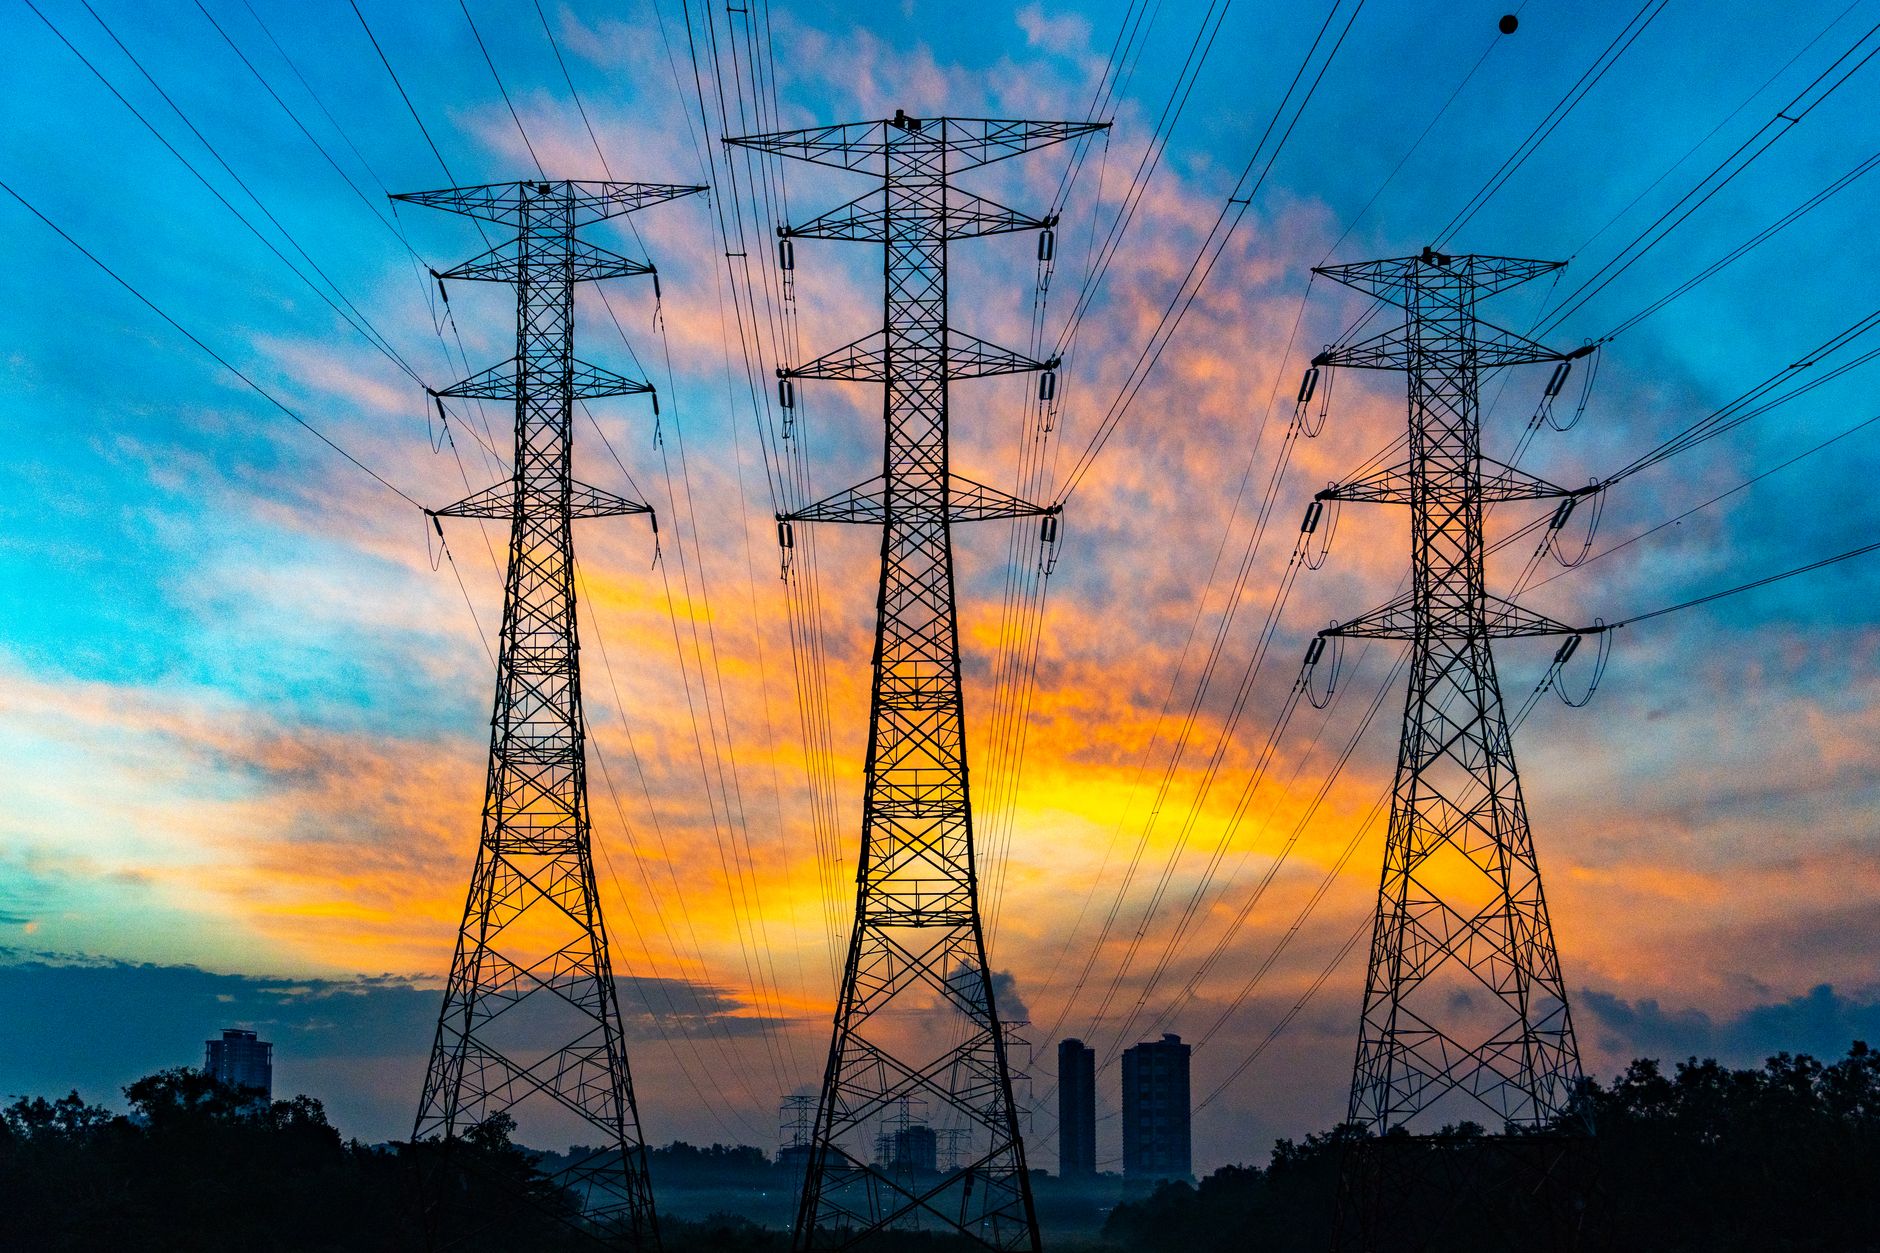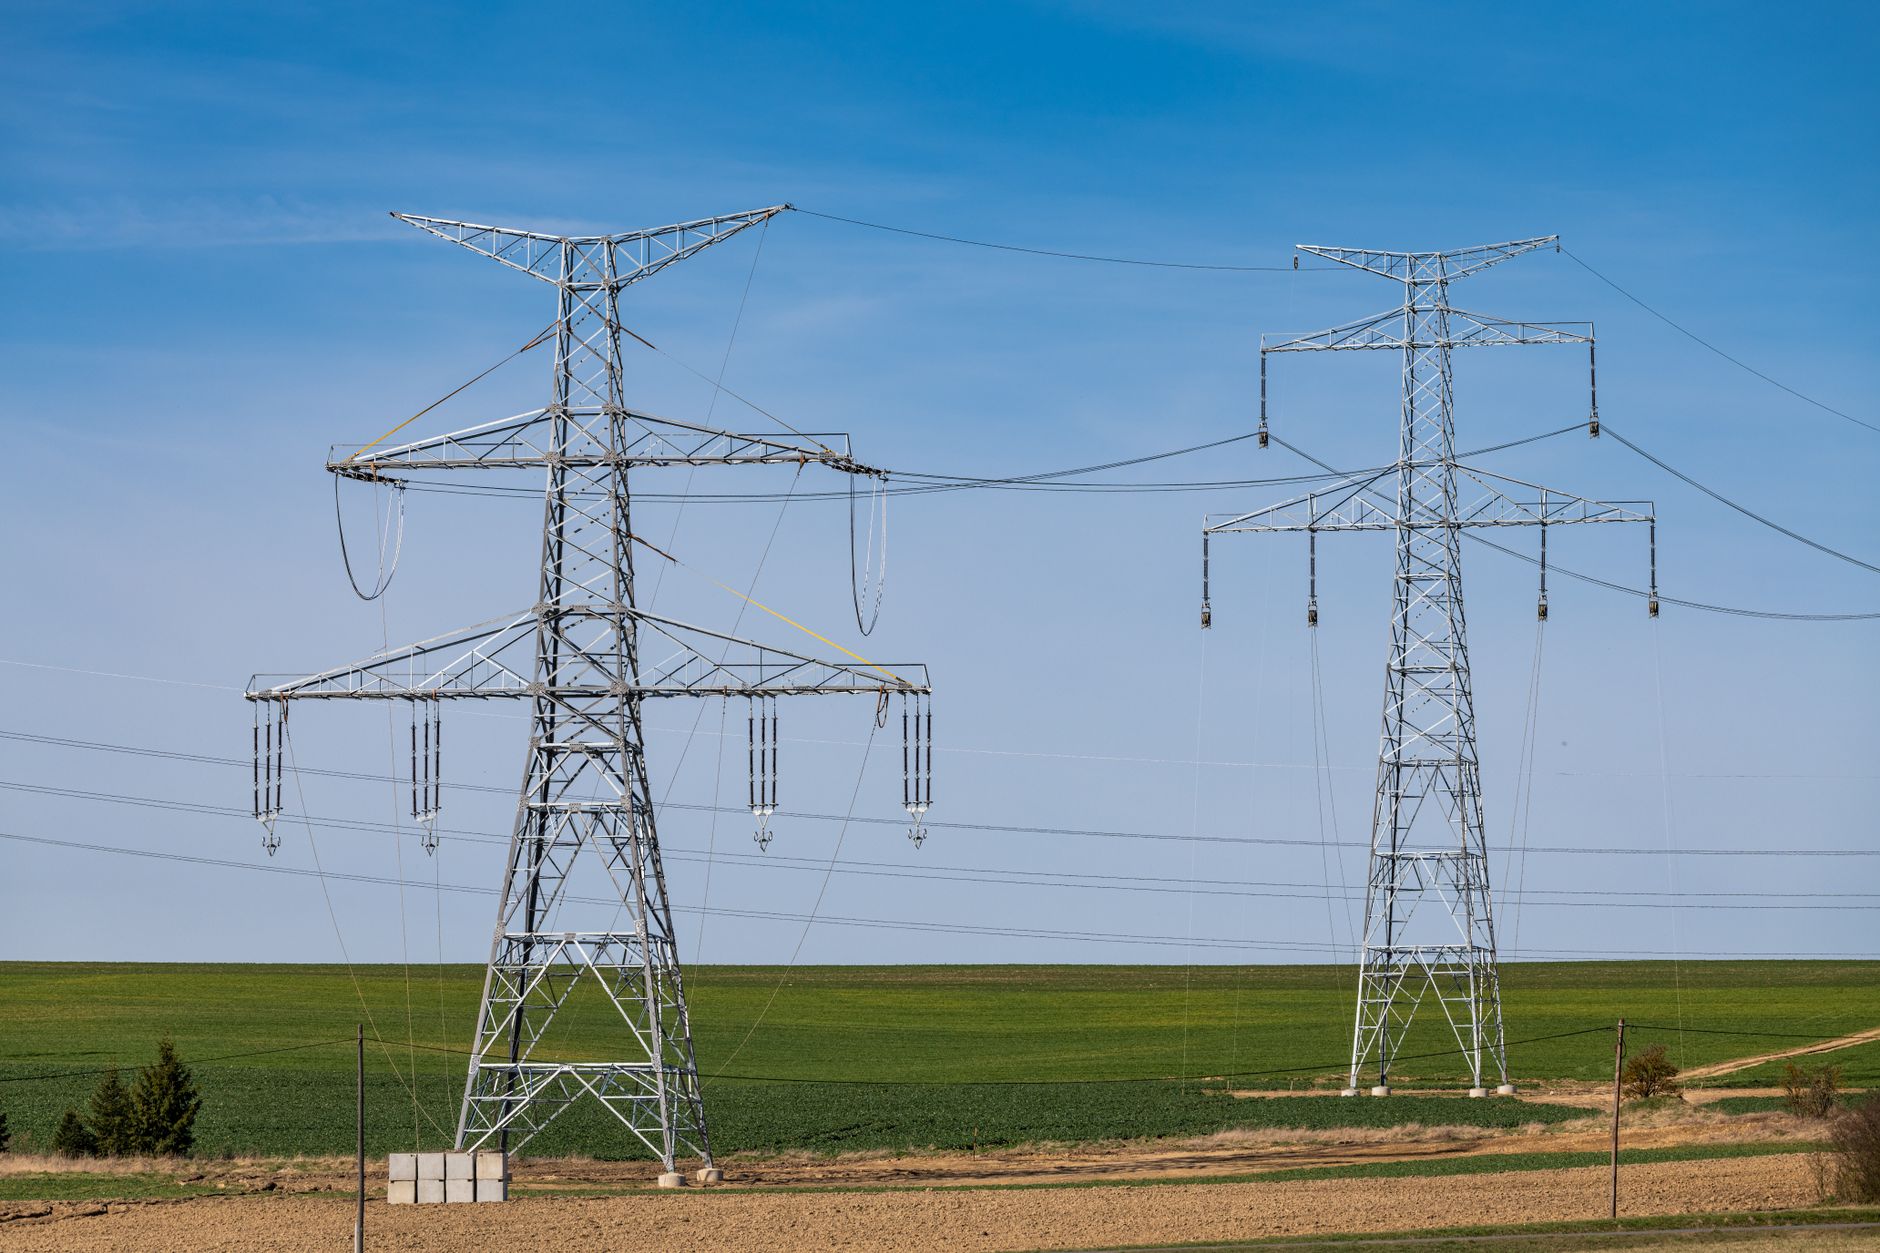
Grid operators routinely instruct wind and solar plants to reduce output even when the wind is blowing and the sun is shining. In some systems, these instructions arrive almost daily. Renewable energy curtailment is often presented as an indictment: expensive generation standing idle, transmission planning that failed, or a market that cannot absorb clean power.
That interpretation collapses two separate mechanisms. Some curtailment reflects a physical limit — the wires between generation and load are full. Some curtailment reflects a market signal — at that hour, additional electricity has no value. Conflating the two leads to poor policy and misplaced investment. Keeping them separate shows why a certain volume of curtailment is not a defect, but a rational operating outcome.
The Physical Constraint: Full Wires, Not Failed Markets
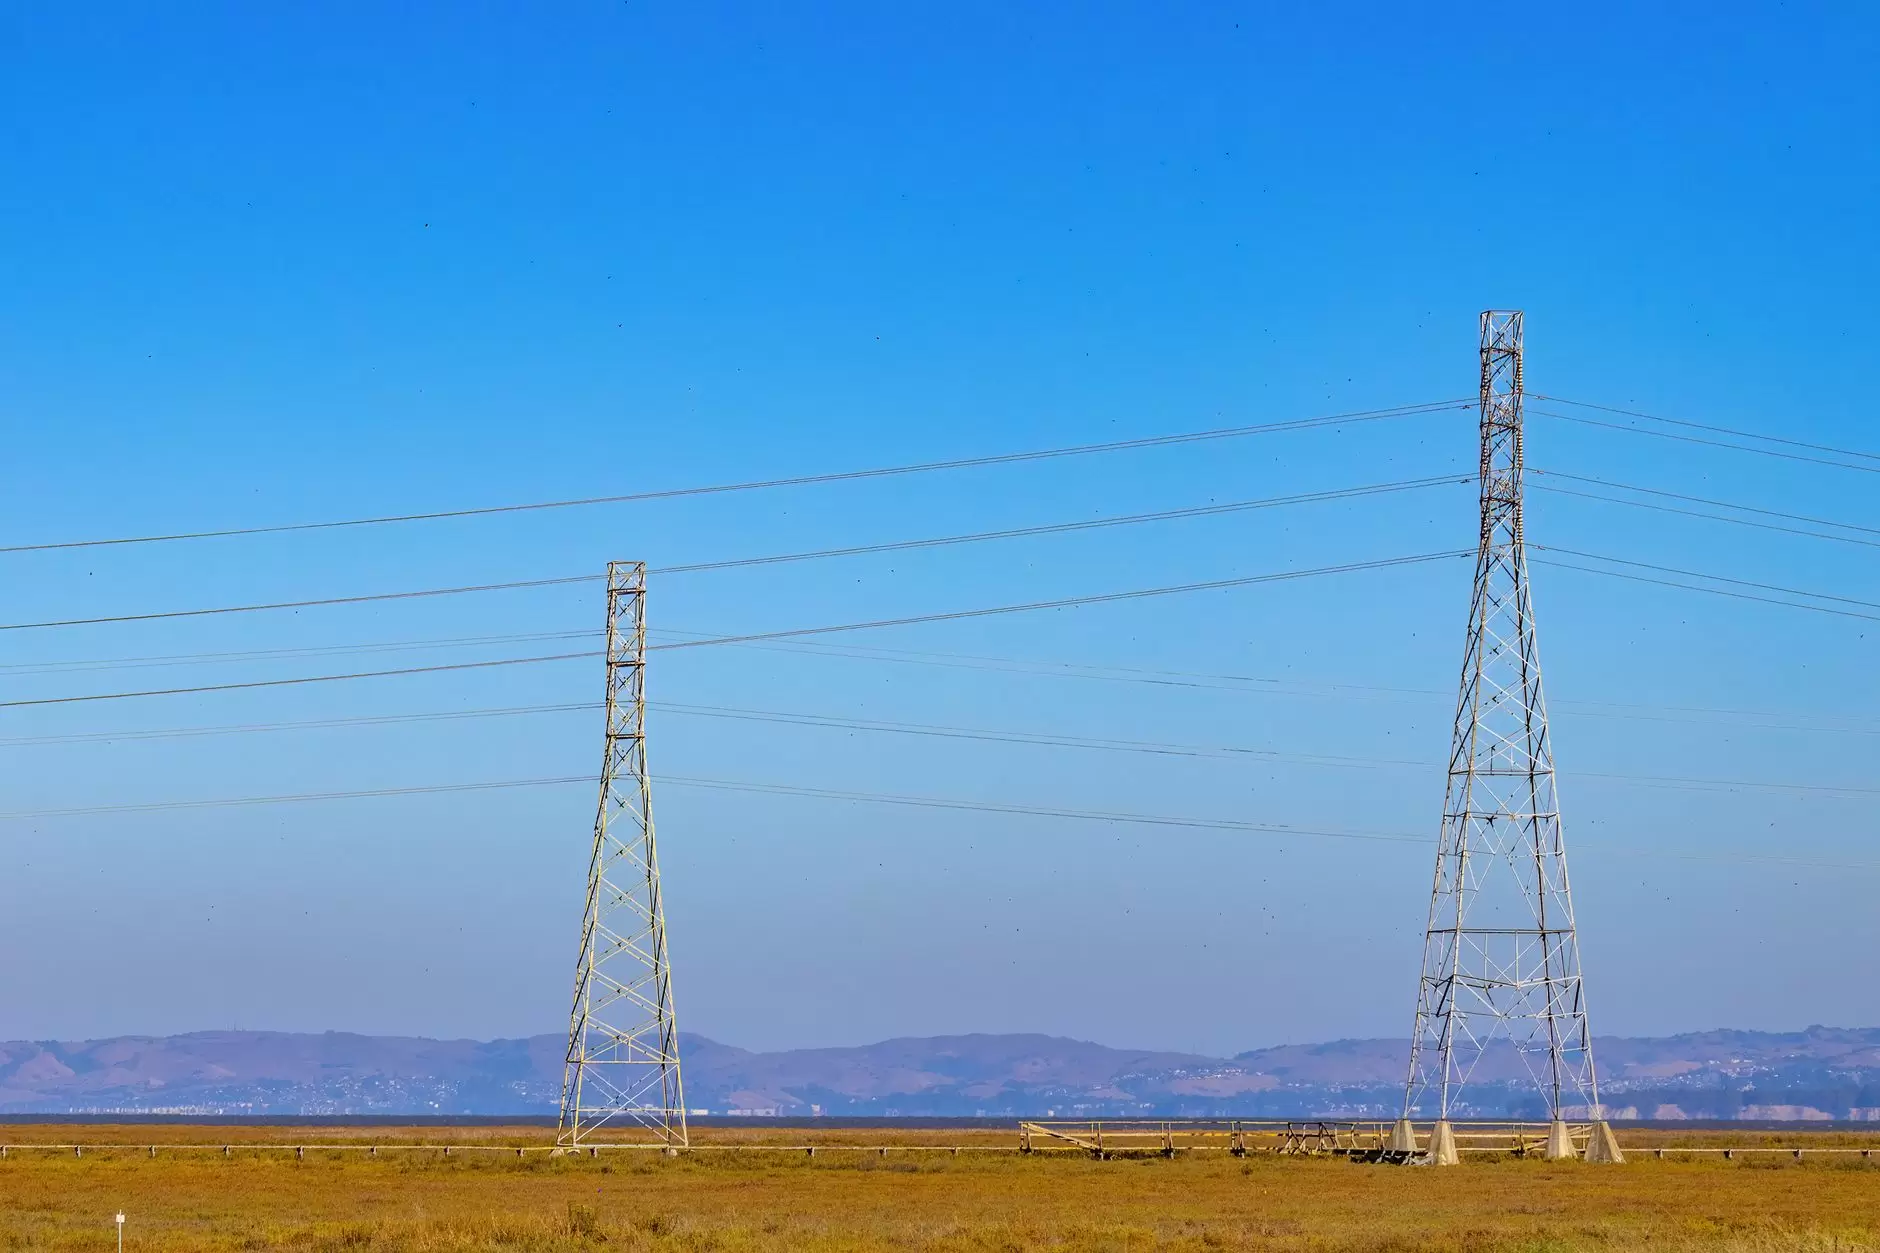
Transmission-constrained curtailment occurs when available generation exceeds the thermal or stability limits of the connecting network. A wind plant in a remote area may have ample resource; if the lines to load centres are saturated, the operator reduces output. This is a physical constraint. Market design alone cannot move more power through a line that is already at its limit.
Networks were historically designed around large, centralised thermal plants located near population centres or fuel sources. Wind and solar resources sit in very different places: strong wind regimes across the Great Plains, solar resource in western China, offshore wind far from coastal demand. The result is grid congestion — a condition where the least-cost generation cannot physically reach load.
When congestion binds, system operators face two imperfect options: curtail the remote renewable generation or dispatch more expensive, closer-in resources. Both raise system costs. Neither is a market failure. The limitation is the physical network, a structural mismatch that persists across hours and seasons rather than resolving with price movements.
Economic Curtailment: When the Market Says Stop
Economic curtailment works differently. It occurs when wholesale prices fall to levels at which generators choose not to produce. For wind and solar plants, which have near-zero marginal cost, that point often comes when prices approach zero or turn negative. The generator is not forced off by a network limit; it backs down because producing would cost more than the revenue it would earn.
On a sunny spring afternoon in California, solar output can exceed system demand during midday hours. As more solar enters the supply stack, wholesale prices collapse. At that point, some plants reduce output rather than pay to remain online. This is not a malfunction. The market is signalling that additional generation has zero or negative value during those specific hours.
The International Energy Agency has noted in its renewables integration analysis that some level of curtailment is inherent to systems with high variable renewable penetration. Curtailment acts as a pressure release valve, avoiding more costly interventions such as forced thermal plant cycling or voltage excursions that could cascade into instability.
Why Some Wasted Megawatt-Hours Are Efficient
The most counterintuitive point is this: building enough transmission to eliminate all curtailment would almost certainly be a poor investment. A line sized to carry every possible megawatt-hour from a remote wind farm — including the infrequent peaks that occur only during the windiest hours — would spend most of its life underutilised. The cost of capturing those last few percentage points of generation would exceed the value of the energy recovered.
This principle is well understood in generation planning but less intuitive in transmission. No one expects a peaking gas plant to run 8,760 hours per year; its economics depend on running during the highest-value hours. A transmission line should be sized for the value it delivers across typical conditions, not for the extreme tail of renewable output that occurs rarely.
Texas applied this logic through its Competitive Renewable Energy Zones programme. The transmission built to connect West Texas wind to load centres accepted that some curtailment would persist during the highest-output periods. The alternative would have required substantially larger investment for diminishing returns. Some level of curtailment is therefore economically optimal — a feature of rational system design, not evidence of failure.
Regional Divergence: Same Number, Different Problem
The acceptable level of curtailment is not universal. It depends on geography, market structure and political priorities — which explains why countries approach the same technical problem differently.
China has historically experienced some of the most visible curtailment, driven overwhelmingly by transmission constraints. The distance between renewable resources in western provinces and demand centres on the eastern seaboard is enormous. More importantly, wind and solar capacity was built faster than the transmission infrastructure required to deliver it. Curtailment rates in some provinces have at times exceeded one-fifth of available output, reflecting planning inefficiency rather than economic optimisation.
Germany faces a different version of the same problem. Wind generation is concentrated in the northern Länder, while industrial demand clusters in the south. The north-south transmission corridors have been delayed by permitting and public opposition, creating persistent congestion. The result is substantial annual redispatch and curtailment costs, though how those costs are allocated varies with market design and regulatory framework — whether socialised across the system, recovered through network tariffs, or settled through specific market mechanisms.
California illustrates the economic variant. The state’s rapid solar buildout has produced a well-known midday oversupply condition, followed by a steep evening ramp. Economic curtailment during spring months, when demand is moderate and solar output high, has become a structural feature of the market. The state has responded by investing in battery storage and regional coordination, implicitly accepting that some level of oversupply curtailment will persist.
What Curtailment Data Should Prompt
Curtailment is most useful as a diagnostic signal. Persistent, geographically concentrated curtailment typically points to transmission inadequacy. If a particular resource zone loses a substantial share of output year after year, the economic case for additional wires becomes harder to ignore. Brief, widespread curtailment during low-demand periods, by contrast, often indicates that storage or demand response would be more cost-effective than new transmission.
This diagnostic value is lost when curtailment data is aggregated into national averages. A country reporting modest total curtailment may have regions with far higher rates and others near zero. The average obscures the investment signal. Regulators who treat curtailment as an embarrassment to be minimised, rather than information to be interpreted, routinely misallocate resources.
The link to interconnection queues matters here. In markets where generators face long delays for transmission interconnection, developers may site projects in areas where curtailment risk is already elevated — not because the resource is ideal, but because the queue is shorter. That dynamic can concentrate curtailment geographically in ways that lock in inefficiency.
The accounting treatment of curtailed energy also deserves attention. Under many certificate systems, curtailed output does not generate renewable energy certificates — though the treatment varies with the applicable framework and the contractual structure around the project. If policy targets are expressed in terms of installed capacity rather than delivered energy, curtailment creates a gap between nominal and actual decarbonisation. That gap can be substantial in high-curtailment regions.
Managing Curtailment Rather Than Eliminating It
Curtailment persists in high-renewable systems. As variable generation penetrations rise, periods of oversupply occur more frequently. The practical question is not whether curtailment happens, but whether the system manages it efficiently and whether the associated costs fall equitably.
Energy storage, particularly battery systems with several hours of duration, can absorb oversupply during peak solar hours and shift that energy into evening demand periods, directly reducing economic curtailment. Regional market integration enlarges the geographic footprint over which supply and demand can balance, turning what would be local oversupply into export opportunity. Demand flexibility, from electric vehicle charging to industrial processes, can shift consumption into periods that would otherwise require curtailment.
Each solution has its own cost curve, implementation timeline and technical limitations. None eliminates curtailment entirely. The systems that manage the transition most cost-effectively are those that distinguish clearly between the two types of curtailment, invest where returns justify it, and treat some wasted megawatt-hours as the price of a rationally sized network rather than a sign of systemic failure.
References
- International Energy Agency — World Energy Outlook 2025 — Renewables integration analysis and the economic rationale for accepting some level of curtailment in high-variable-renewable systems.
- ENTSO-E — Transparency Platform — European transmission system data on north-south congestion in Germany and associated redispatch and curtailment volumes.
- North American Electric Reliability Corporation — Long-Term Reliability Assessment — Transmission adequacy analysis and interconnection constraints affecting renewable integration.